Member-only story
Robust Statistics: The Influence Function
Measuring Performance in the face of Outliers
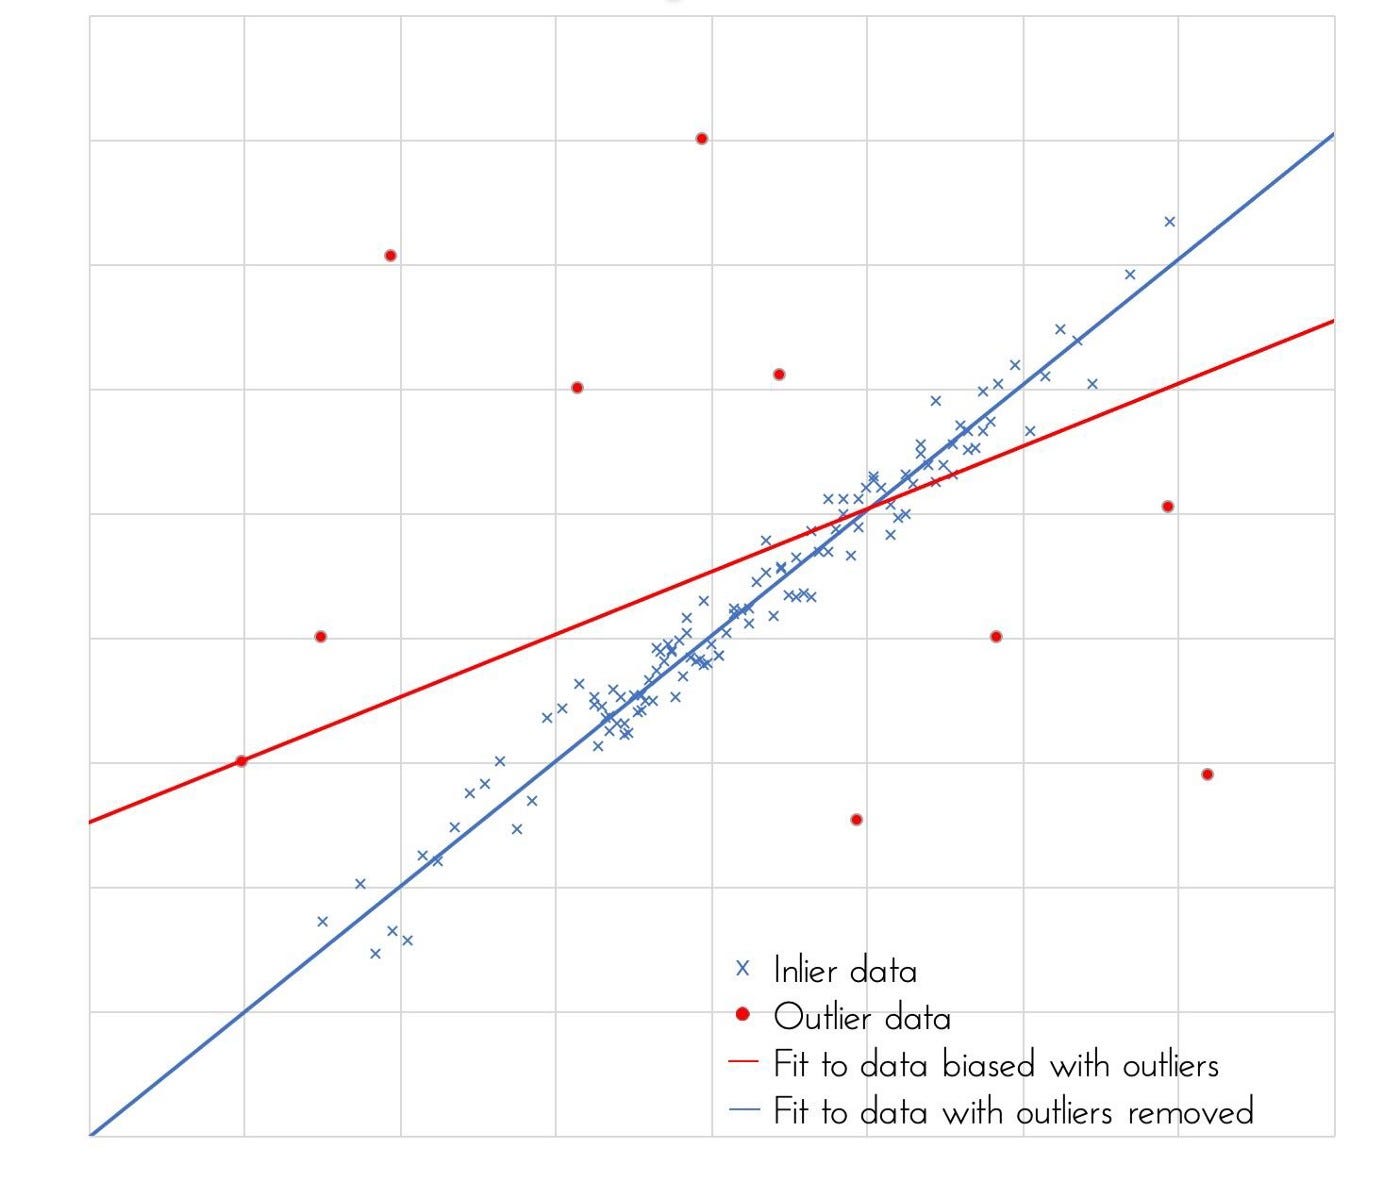
The statistical framework built around metrics like standard deviation and the mean only really works in reality for thin tailed or ‘normal’ events. However, there are many cases where the assumption of normality doesn’t hold. A good example is stock market returns, where we observe a much greater frequency of outliers than the normal distribution allows for. Under these circumstances, the Law of Large Numbers (LLN) and Central Limit Theorem (CLT) begin to break down and the sample statistics lose their meaning as they don’t converge fast enough.
The goal of robust statistics is to develop more robust estimators in the face of outliers, but in order to do this, the first step is to quantify estimator performance.
The Maths
The Influence Function (IF) measures the impact of an infinitesimal fraction of outliers on an estimator.
Let’s define a metric of a probability distribution as θ(X) where X is any probability distribution function. This metric can be anything; for example, a measure of the spread of the distribution (e.g. standard deviation).
Now, suppose we have a ‘normal’ distribution with thin tails, f. We contaminate this with an outlier distribution g, which is generally assumed to be a point mass at z. This gives a resultant distribution:
Where ε is the fraction of contamination. Taking the sample estimate of θ, the IF is then defined:
This derivative tells us the rate of change of the sample estimator as the fraction of contamination changes.
Desirable Properties
The IF should ideally be bounded and continuous:
- Bounded: A small fraction of outliers cannot break down the estimator
- Continuous: A small change in the fraction of outliers yields a small change in the estimator
To demonstrate this, let’s quantify the performance of different measures of the ‘average’ of a distribution. As illustrated in another article, there are many ways to measure this ‘average’, such as the mean, median or a combination of both in the Huber estimator. A plot of the…